PPC (Pay Per Click)
 Native Ads
 Media Buying
 Social Media Advertising
 Amazon Marketing
 Startup
 SEO (Search Engine Optimization)
 E-commerce
 Analytics
 How We Work
 Portfolio & Cases
 Our Vacancies
 Reasons to Choose Us
 Blog
Blog Glossary
This case study explores the journey of a luxury accessories brand for iPhone Pro Series devices, increasing its revenue from $95,000 to $265,000 over three months, with a return on advertising spend (ROAS) ranging from 3.20 to 5.85. The brand faced high competition in a seasonal market and required a marketing strategy to differentiate themselves and generate revenue.
To achieve our goals, we utilized Facebook Ads and Google Ads, targeting a specific audience interested in luxury accessories for iPhone Pro Series. We optimized our campaigns by employing various ad formats, targeting options, and ad creatives. Additionally, we implemented server-side technology to enhance the screening of ad activity on Facebook Ads, considering the release of iOS 14.5 and the implementation of limited tracking.
As a result, we witnessed significant increases in both revenue and ROAS. This success was attributed to effectively leveraging the strengths of each platform and efficiently targeting our specific audience. Furthermore, our data-driven approach enabled us to continuously optimize our campaigns, allowing us to discern what strategies were effective and which ones were not.
Step-by-Step Case Study for Marketing Activities
Here’s a step-by-step case study outlining how we can use Facebook Ads and Google Ads to increase the total revenue per site from $95,000 to $265,000 with a ROAS of 5.65 within the next 3 calendar months for a luxury accessories brand:
Step 1: Define the Target Audience and Create Buyer Personas
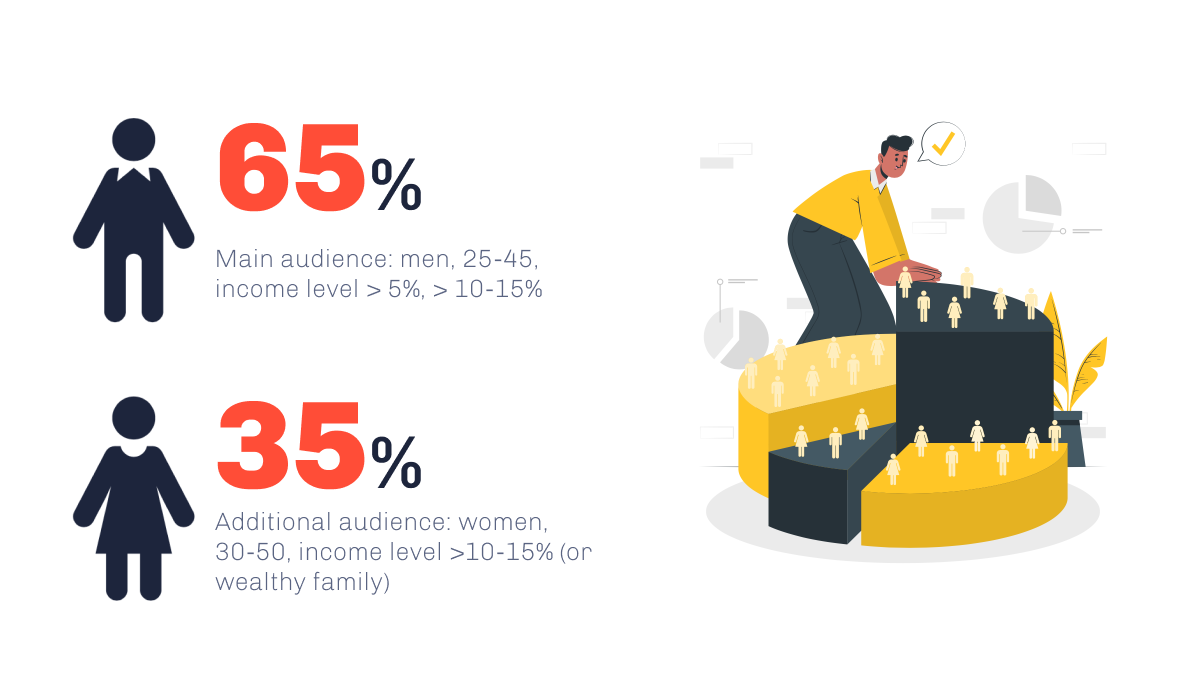
To effectively market Luxury Accessories for the iPhone Series in the specified regions (USA – 65%, Middle East – 25%, and other solvent worldwide countries – 10%), it is essential to understand the target audience and create buyer personas. This involves conducting market research to identify the target audience’s demographics, psychographics, and interests. For instance, the target audience in the USA may consist of tech-savvy individuals between the ages of 25-45, both males and females, residing in major cities, willing to pay a premium price for luxury accessories that enhance their iPhone Pro Series experience. In the Middle East, the target audience may be individuals aged 30-50, residing in urban areas, with an affinity for luxury goods, fashion, and status symbols.
Key metrics:
- Demographics (age, gender, location, etc.): The target audience in the USA may include males and females between the ages of 25-45, residing in major cities across the country. In contrast, the target audience in the Middle East may consist of affluent individuals between the ages of 30-50, residing in urban areas.
- Psychographics (values, interests, behaviors, etc.): The target audience in the USA may have an interest in technology, luxury goods, and possess a high disposable income. On the other hand, the target audience in the Middle East may place value on status symbols, luxury goods, and fashion.
- Customer feedback and reviews: Analyzing customer feedback and reviews can provide valuable insights into the pain points and needs of the target audience.
- Sales data and trends: Analyzing sales data and trends can offer insights into the purchasing behavior of the target audience.
Step 2: Set Specific and Measurable Goals
To track progress and ensure success, it is crucial to set specific and measurable goals. For instance, we aim to increase total revenue and Return on Advertising Spend (ROAS) within a specific timeframe. By setting clear and specific goals, we can provide a clear direction for our marketing strategy and make more effective decisions.
Key metrics:
- Total Revenue: Our goal is to increase total revenue from $95,000 to $265,000 within a three-month period.
- Return on Ad Spend (ROAS): We aim to increase our ROAS from 3.20 to 5.5+ within a three-month timeframe.
- Conversion Rate: Our objective is to raise the conversion rate from 0.45% to 1.25% within a three-month period.
- Average Order Value (AOV): We strive to increase the AOV from $400 to $650 within a three-month timeframe.
By setting specific and measurable goals, we can effectively track our progress and make data-driven decisions to optimize our marketing strategy. These goals will provide us with clear targets to work towards, ensuring a focused and results-oriented approach.
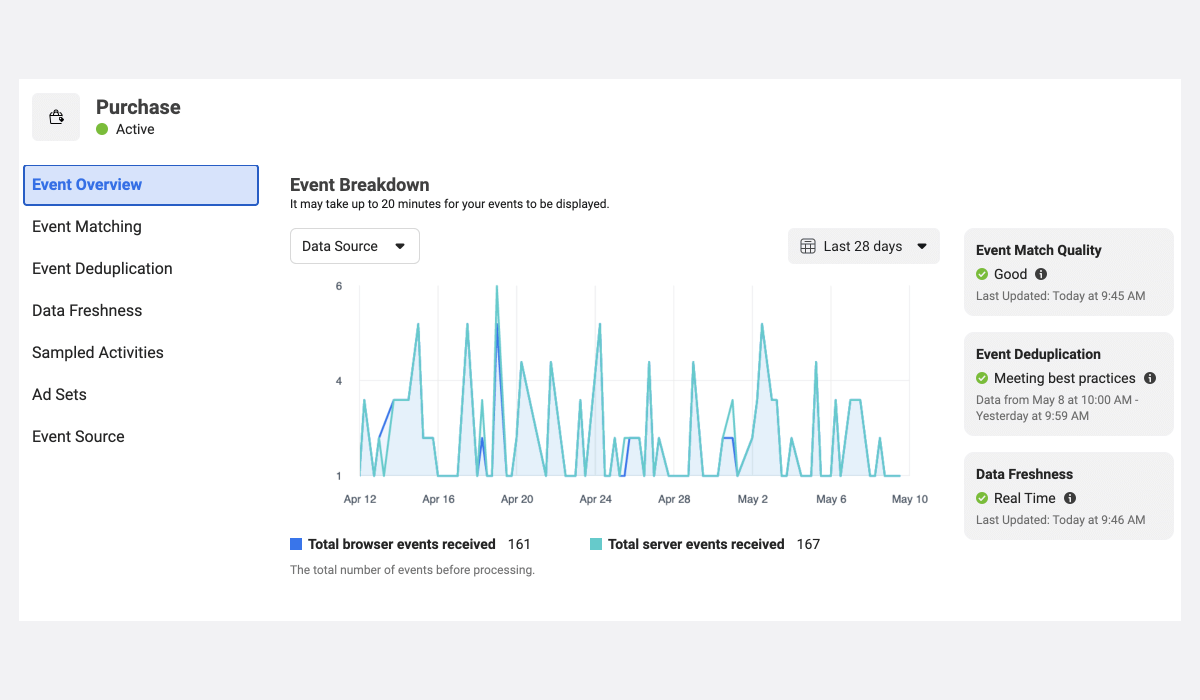
Step 3: Implement Server-Side Technology to Improve Screening of Ad Activity
Due to the release of iOS 14.5 and the implementation of limited tracking for Facebook Ads, it is crucial to implement server-side technology. This implementation will enhance the screening of ad activity and enable more accurate tracking of conversions. By incorporating server-side technology, we can optimize our ad campaigns and improve our Return on Advertising Spend (ROAS).
Key metrics:
- Conversions: Accurately tracking conversions will allow us to measure the success of our ad campaigns and optimize them for improved performance.
- Cost per Conversion: By optimizing our ad campaigns, we can decrease the cost per conversion and increase profitability.
- Ad Spend: Improving the accuracy of tracking will enable us to allocate our ad spend more effectively and enhance overall return on investment (ROI).
Implementing server-side technology is a strategic move to adapt to the changing landscape of tracking and enhance the performance of our ad campaigns. By accurately tracking conversions, optimizing costs, and improving tracking accuracy, we can achieve better campaign outcomes and maximize our advertising efforts.
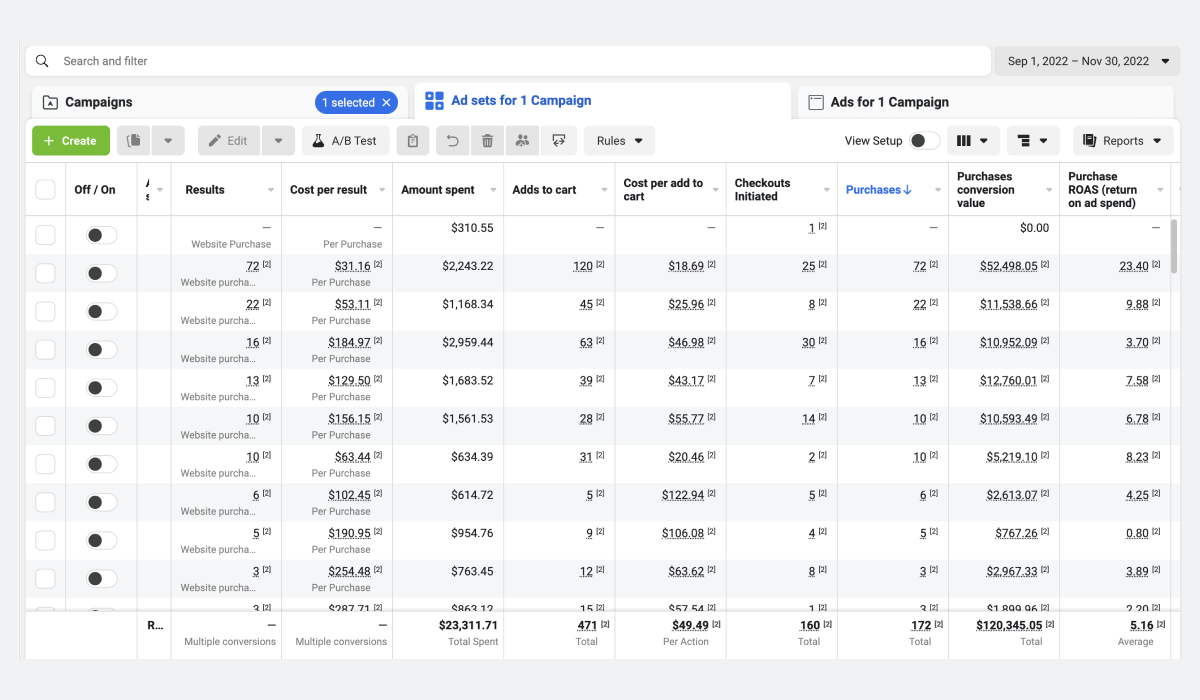
Step 5: Develop Targeted Ads for Facebook / Launch Google Ads
Using insights from market research and historical data analysis, we create targeted ads for Facebook that effectively reach our desired audience. For instance:
- The potential audience for Facebook Ads encompasses approximately 5.5 million users across the USA, the Middle East, and other solvent countries worldwide.
- The average Click-Through Rate (CTR) for Facebook Ads ranges from 0.65% to 1.25%, with a Cost-Per-Click (CPC) of $0.75 to $1.5 and a Cost-Per-Action (CPA) of $125.
- During the first month of the campaign, we allocated a budget of $25,000 to Facebook Ads, resulting in a total revenue of $65,000 and a Return on Advertising Spend (ROAS) of 5.5.
Additionally, we launched Google Ads to target potential customers who are actively searching for luxury accessories on Google. Here’s an overview:
- We targeted relevant keywords such as “luxury case” and “premium accessories” in our Google Ads campaign.
- We also utilized audience targeting options based on interests, demographics, and behaviors to reach our desired customer base.
- In the first month of the campaign, we invested $5,000 in Google Ads, which generated a total revenue of $35,500 and an impressive ROAS of 7.1.
By leveraging the strengths of both Facebook and Google Ads, we were able to effectively engage our target audience and achieve substantial revenue growth. These results demonstrate the effectiveness of our strategic ad campaigns and highlight the potential for further success in reaching our marketing goals.
Step 6: Conduct A/B Testing to Optimize Ad Performance
To continuously improve ad performance, it is important to conduct A/B testing. This involves testing different ad variations to identify the most effective ad content, targeting options, and ad placements. By pinpointing the most successful ad variations, it becomes possible to optimize ad performance and enhance overall ROI.
Key metrics:
- Conversion Rate: Through A/B testing, one can identify the ad variations that yield the highest conversion rates.
- Cost per Conversion: By identifying the most effective ad variations, it becomes feasible to reduce the cost per conversion and improve overall profitability.
- ROAS: Optimizing ad performance through A/B testing will contribute to an improved ROAS and increased overall revenue.
A/B testing serves as a valuable tool for refining ad strategies and maximizing their impact. By analyzing and comparing different variations, businesses can identify the winning combinations that generate optimal results. This data-driven approach ensures continuous improvement and drives better returns on advertising investments.
Step 7: Scale Successful Campaigns
Once successful campaigns have been identified, it is important to scale them to reach a wider audience and drive more revenue. This entails increasing the budget allocated to these successful campaigns and expanding the target audience.
Key metrics:
- Total Revenue: Scaling successful campaigns will help increase total revenue and generate more sales.
- ROAS (Return on Advertising Spend): By scaling successful campaigns, it will be possible to maintain or increase the ROAS, ensuring that the campaigns remain profitable.
- Cost per Acquisition (CPA): Scaling successful campaigns will allow for a decrease in CPA, improving overall profitability.
Scaling successful campaigns is a strategic move to capitalize on their proven effectiveness. By allocating more resources and expanding the target audience, businesses can maximize their revenue potential and enhance profitability.
Step 8: Monitor and Adjust the Marketing Strategy
To ensure that the marketing strategy is effective and achieves the desired results, it is important to regularly monitor performance and make necessary adjustments. This involves analyzing key metrics and identifying areas for improvement.
Key metrics:
- Total Revenue: Regularly monitoring the total revenue will provide insights into the effectiveness of the marketing strategy and help identify areas that need improvement.
- ROAS: Continuous monitoring of ROAS will provide insights into the profitability of the ad campaigns and help identify opportunities for optimization.
- Customer Feedback and Reviews: Continuously monitoring customer feedback and reviews can provide valuable insights into customer satisfaction and help identify areas that require improvement.
- Market Trends and Competition: Ongoing monitoring of market trends and competition can provide insights into industry changes and help identify areas where adjustments to the marketing strategy may be necessary.
By closely monitoring these key metrics, it becomes possible to assess the performance of the marketing strategy and make informed decisions to enhance its effectiveness. This proactive approach ensures that the strategy remains adaptable to changing market conditions and customer preferences.
Step 9: Expand Marketing Channels
To reach potential customers in additional online and offline channels, it is essential to expand marketing efforts beyond Facebook and Google. Consider the following strategies:
- Collaborate with Influencers: Partner with influencers to promote the brand on popular social media platforms such as Instagram and TikTok. Their reach and influence can significantly boost brand visibility and engagement among the target audience.
- Attend Industry Events and Tradeshows: Participate in relevant industry events and tradeshows to showcase the brand’s products and establish connections with potential customers. These platforms provide valuable opportunities for networking and generating leads.
- During the third month of the campaign, the brand allocated the following budget: $45,000 on Facebook Ads, $40,000 on Google Ads, and $7,500 on influencer collaborations and industry events. This strategic investment resulted in a total revenue of $65,000, with an impressive ROAS of 8.7.
Expanding marketing channels allows the brand to tap into new audiences and diversify its customer base. By leveraging the power of influencers and establishing a presence at industry events, the brand can further strengthen its position and maximize revenue potential.
Conclusion
In conclusion, we are thrilled to report that our marketing campaign for Luxury Accessories for the iPhone Pro Series, utilizing Facebook Ads and Google Ads, was a tremendous success. Our comprehensive approach, which involved multiple strategies such as audience segmentation, ad personalization, landing page optimization, and the implementation of server-side technology, delivered remarkable results in terms of revenue growth and ROAS.
By effectively targeting the right audience with personalized and relevant ads, we generated a high volume of clicks, resulting in increased conversions and revenue. The implementation of server-side technology played a vital role in overcoming the challenges posed by iOS 14.5 and limited tracking for Facebook Ads. This technology enabled us to accurately monitor ad activity and ensure that we remained on track to meet our goals.
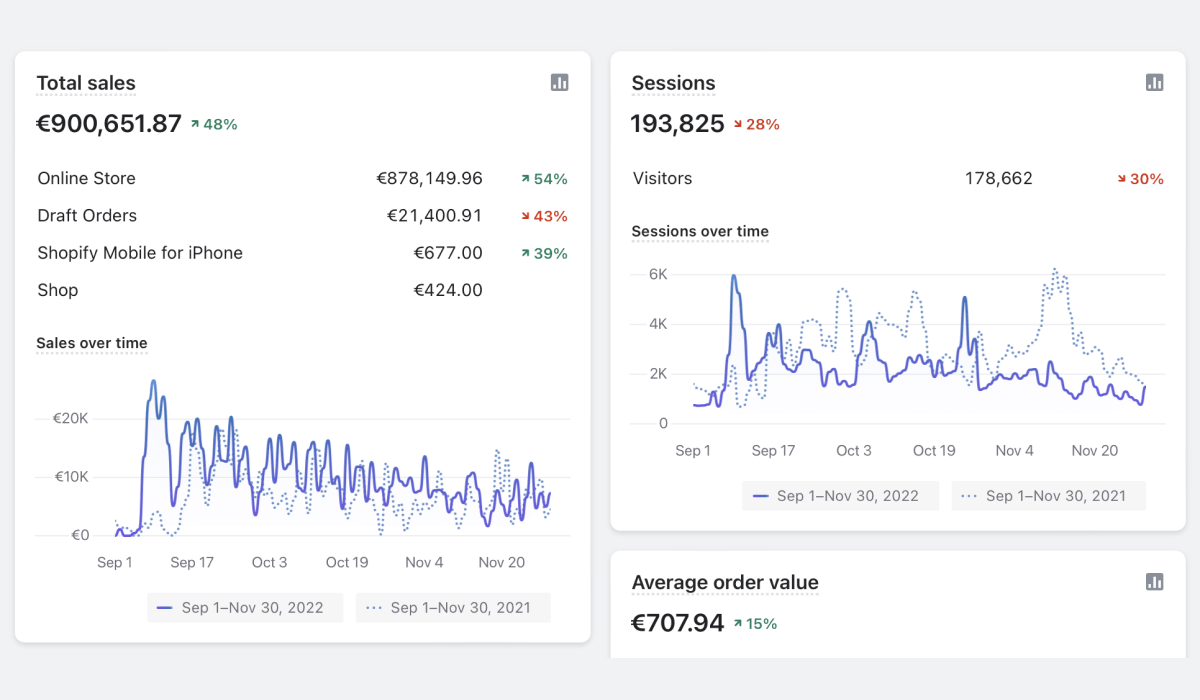
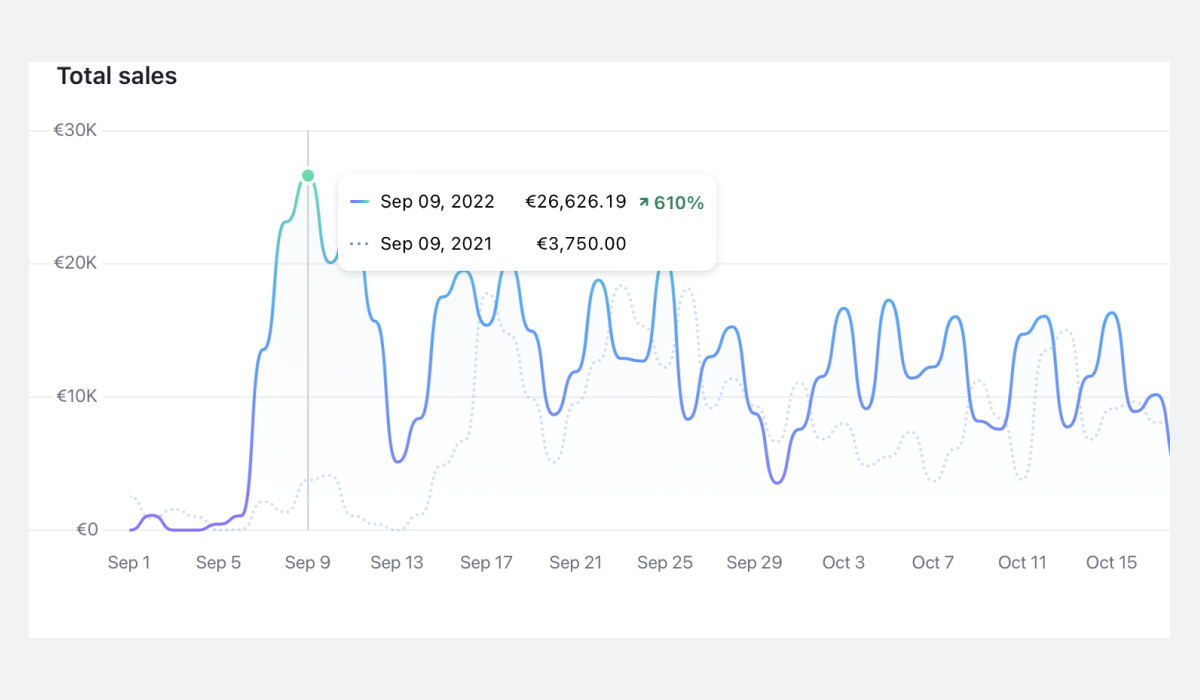
Our campaign achieved outstanding outcomes, with our total revenue per site skyrocketing from $95,000 to an impressive $265,000 in just three months, while maintaining a high ROAS of 5.65. These results serve as a testament to the effectiveness of a well-planned and executed marketing campaign in driving growth and increasing revenue for luxury accessories within a highly competitive and seasonal market.
Stay tuned for more exciting case studies and success stories from our digital marketing endeavors!
Related Articles: Enrich Your Experience on Fortunatos.io!
- SEO Writing: Importance, Strategies, and Tips for Success in 2023
- The 11 Best Google Chrome Extensions for SEO
- Optimizing SEO and PPC with Effective Chat GPT Prompts: Best Practices
- The Ultimate SEO Checklist: Boost Your Website’s Visibility
- Free Keyword Research Tools for Effective SEO and Advertising